
It might not be one of the first things we think about when it comes to carbon emissions, but our online presence directly contributes to global emissions. In this guide we delve into the digital landscape, uncovering the extensive environmental impact of internet usage (and more) across the globe. From vast data centres to individual users’ digital habits, we examine the environmental implications of our interconnected world and highlight the challenges and opportunities in reducing the internet’s carbon footprint. And we explore what steps can be taken to foster a more sustainable digital future.


An introduction to digital carbon footprints
A digital carbon footprint is the carbon emissions and resulting environmental impact of using the internet and taking part in other online activities.
When most activity takes place on a screen, it’s easy to see why we wouldn’t think the internet had so much of an effect on the environment. But every time someone uses the internet, on any device, they produce and download a lot of data, which is stored in data centres located across the globe. The data centres need to run constantly and must be cooled so they don’t overheat, which requires significant amounts of energy. In 2021 it was estimated there were 7.2 million data centres around the world.
Data storage is just one thing which contributes towards the digital carbon footprint. It’s made up of multiple elements of digital technology, including:

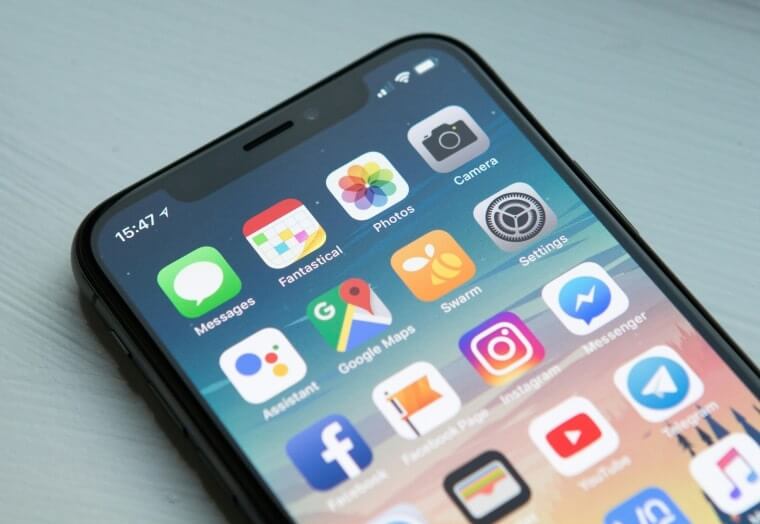
The devices
Smartphones, laptops, monitors, routers, cables etc, and the materials required to manufacture them in large numbers. Many devices require rare metals, which have to be mined. And most aren’t easy to repair, which perpetuates a culture of throwing things away to buy new replacements while the old devices end up in landfill.

Ancillaries
The equipment and electricity required to use the devices (e.g. chargers, routers). The impact of this can be reduced by using a renewable energy provider.
The digital activities
Streaming video requires a lot of energy, while using a search engine consumes much less, for example. It’s thought that email use across the world generates emissions equivalent to having 7 million more cars on the road.
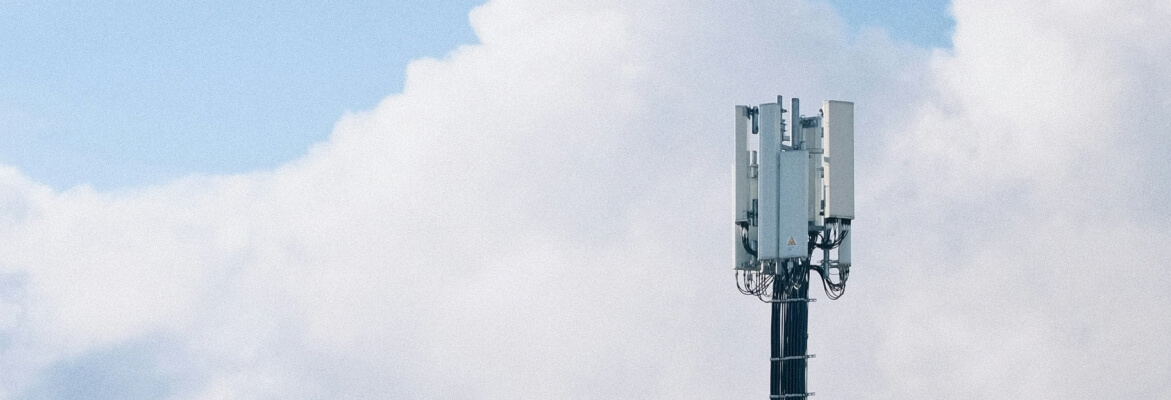
Data transfer
Including 5G network transmitters and cable internet.
To understand why this is significant, let’s take a look at the impact of climate change on people and the planet.

The environmental implications of the internet
A digital carbon footprint is the carbon emissions and resulting environmental impact of using the internet and taking part in other online activities.
We rely on digital services more and more as technology develops. For example, we’ve moved from cash payments, to card payments, to contactless card payments, to mobile payments — theoretically you could leave your home with just a smartphone and make your way around without issues. But these developments mean the carbon footprint of the internet is only going to increase.
World events can also have an impact on the digital carbon footprint. In 2020, in the midst of the pandemic, global internet traffic increased by over 40%. This isn’t a surprise when you consider how most of us were sheltering at home, turning to streaming, gaming and social media for distraction and using video calls to keep up with our loved ones and our careers. However, the lack of travel meant other emissions decreased dramatically. The UK’s greenhouse gas emissions decreased by 9.5% in 2020 compared to the previous year, and were a staggering 49.7% lower than the 1990 figures.
The impact of climate change
Climate change is the term used when warmer temperatures change weather patterns. One of the biggest causes of climate change is fossil fuels, which produce greenhouse gases like carbon dioxide. These gases trap the sun’s heat, which is what leads to higher temperatures.
Climate change results in the following:
Higher temperatures and more heatwaves
More greenhouse gases leads to higher temperatures, with many areas around the world experiencing more hot weather than they did previously. For example, January 2024 was the warmest January on record. The average surface air temperature was 13.14℃, 0.12℃ above the previous record in January 2020 and 0.70℃ above the 1991-2020 average for January.
Wildfires also start more easily in hot weather. Many countries experienced record-breaking wildfire activity in 2023, with notable wildfires occurring in Canada, Maui, Greece, Spain, Portugal, the Canary Islands, Chile, Argentina, Australia, and Russia. The fires themselves produce carbon emissions, so it’s a vicious cycle.
Increased drought
Water shortages are becoming more common, which leads to fewer crops and leaves people without enough water for drinking, cooking or washing.

January 2024 was the warmest January on record. The average surface air temperature was 13.14℃, 0.12℃ above the previous record.

More severe weather events
Storms and excessive rainfall are becoming more frequent, which leads to flooding, damage, and even death. In the UK, the Met Office reported that:
“human-induced climate change made the heavy storm downpours and total rainfall across the UK and Ireland between October 2023 and March 2024 more frequent and intense”.
Loss of species
Not every species is able to adapt to all the changes in this list, leading to extinction. A recent study by the University of Oxford concluded that “species exposed to greater climate change were more likely to become extinct”.
Food shortages
Changing weather conditions mean the production of multiple food sources is compromised, leading to shortages and, in more severe cases, nutritional deficiencies and even starvation.
Healthcare struggles
Air pollution, severe weather events and food shortages can cause physical health issues for humans, such as nutritional deficiencies and heat-related illnesses like heatstroke. Extreme heat can exacerbate existing health conditions, including cardiovascular disease, diabetes, and asthma. There’s also the mental health side: the stress and worry of dealing with these events can be significant, with the term ‘climate anxiety’ coined to describe it.
Poverty and climate migration
The more extreme results of climate change can leave people in poverty and even homeless, due to losing their livelihoods and communities, resulting in them seeking refuge elsewhere. By the end of 2023 an estimated 7.7 million people across 82 countries and territories were displaced as a consequence of disasters occurring in 2023 and earlier, an 11% increase compared to the 2022 figures.
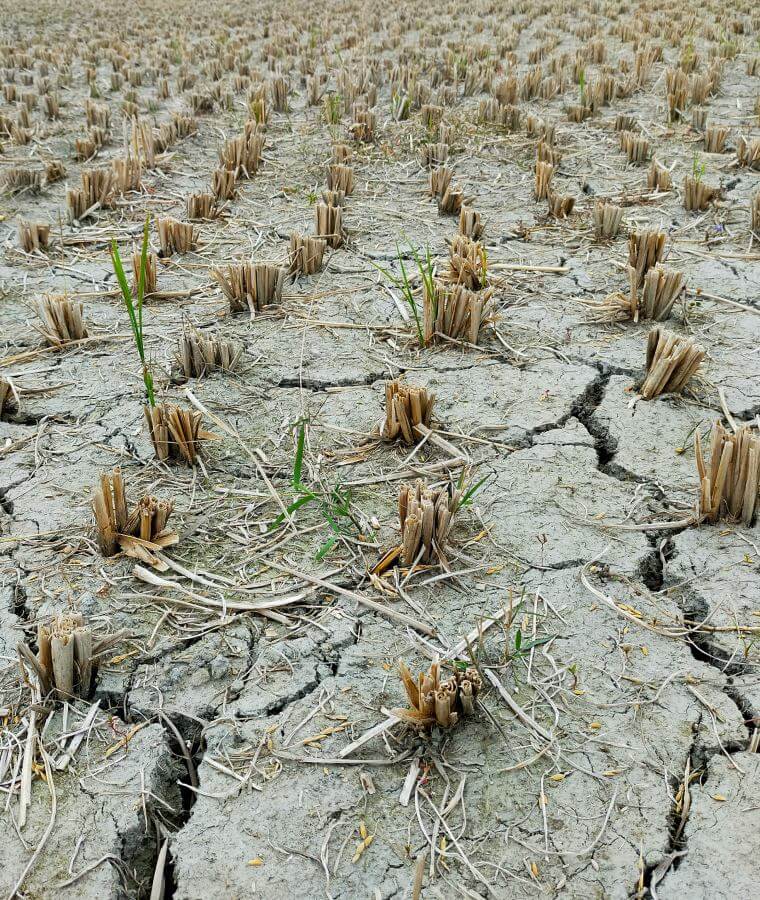
Changing weather conditions mean the production of multiple food sources is compromised, leading to shortages.


A country-by-country exploration of digital carbon footprints
It can be difficult to know the digital carbon footprint of a country, but we can get a general idea of it by looking at their overall carbon footprints and how widespread internet use is in each place.
The countries with the largest carbon footprints are:
China
United States
India
Russia
Japan
Indonesia
Iran
Germany
South Korea
Saudi Arabia

Scroll for more »
Interestingly, not all of these locations make the top ten when it comes to which countries have the most data centres:
United States (2,701)
Germany (487)
UK (456)
China (443)
Canada (328)
France (328)
Australia (287)
Netherlands (281)
Japan (207)
Russia (172)

Scroll for more »
Let’s take a look at the carbon footprints of these countries and where digital activity fits in, as well as their future plans for reducing emissions.


Australia
Australia regularly publishes quarterly updates about their national emissions, known as the National Greenhouse Gas Inventory. The most recent update reported that emissions totalled 432.9 million tonnes of carbon between December 2022 and December 2023, a 0.5% decrease compared to the previous figure. Emissions from electricity were 4.4 million tonnes — down 2.8% due to increased use of renewable energy. Overall, emissions have decreased by 29% since June 2005.
There are 22.13 million internet users in Australia, which is approximately 91% of the population. This number is predicted to increase to over 23.3 million by 2025. Most people (53.27%) access the internet through a laptop or desktop computer, while 42.58% access it through a mobile phone and 4.12% through a tablet. All these devices will create emissions through the electricity required to charge them, not to mention the emissions previously produced through the manufacturing stage.
Interestingly, figures seem to suggest that Australians are cutting down on their social media consumption, with reports noting that 78.5% of the population had active accounts in October 2023, down from 80.4% in February 2023. However, Facebook, Reddit and Instagram all made the list of the top-ten most-visited websites in Australia (other notable sites included Google, News.com.au, and Wikipedia).
Australia currently has three Nationally Determined Contribution (NDC) goals as part of the Paris Agreement:
Reduce greenhouse gas emissions to 43% below 2005 by 2030.
A multi-year emissions budget of 4,381 million tonnes of CO2-e for the period 2021 to 2030.
Achieve net zero emissions by 2050.

Reports note that 78.5% of the population had active social media accounts in October 2023, down from 80.4% in February 2023.

Canada
Canada has published an annual national inventory report since 1996, which tracks emissions from all sectors of their economy. The 2024 report covers the year 2022, with total emissions equalling 708 million tonnes of CO2-e and the breakdown as follows:

The total emissions were higher than the previous year as the country rebounded from the pandemic slowdown, but lower than the 2019 figures.
As for where the digital footprint fits in amongst all this, there were 36.74 million internet users in Canada as of January 2024 — around 94.3% of the population. The same source reports that there were 31.9 million active social media accounts at the same time, though it’s worth pointing out lots of people have more than one account, so the number of individuals isn’t this high. 86.8% of the population used at least one social media platform.
As well as social media, many Canadians — 78% — use the internet for online banking. A smaller percentage, 16%, also manage their investments online. 47% use a smart home device; these technologies are relatively new developments and will have undoubtedly added to the digital carbon footprint.
Canada currently has two main climate targets:
Achieve net zero by 2050.
Reduce greenhouse gas emissions by 40-45% compared to 2005 levels by 2030.

As well as social media, many Canadians — 78% — use the internet for online banking.
China
The total energy consumption of China increased by 5.7% in 2023 compared to 2022, and the country is currently off track to meet its climate targets for 2025. However, clean energy is a significant factor in the growth of China’s economy. Approximately 1% of 2023’s emissions growth was caused by manufacturing technology like solar panels, electric vehicles and batteries, which will reduce emissions in the long term.
Digital activity plays a huge role in China’s carbon footprint, with around 1.09 billion internet users. This equates to 78% of the population, with rural areas waiting on the infrastructure that will allow them to connect. There are 1.06 billion active social media accounts in China, with the number of users increasing by 2.9% between late 2023 and early 2024. 97.1% of internet users there have at least one active social media account.
But social media isn’t the only popular activity. The number of people using online services is growing rapidly, as you can see in the table below:
Services |
Number of users |
Growth |
|---|---|---|
Video streaming |
1.067 billion |
97.7% |
Instant messaging |
1.060 billion |
97% |
Short video |
1.053 billion |
96.4% |
Online government services |
973 million |
89.1% |
Online payments |
954 million |
87.3% |
E-commerce |
915 million |
83.8% |
Search engines |
827 million |
75.7% |
Live streaming |
816 million |
74.7% |
Online music |
715 million |
65.4% |
Online food delivery |
545 million |
49.9% |
Ride hailing |
528 million |
48.3% |
Online literature |
520 million |
47.6% |
Online travel booking |
509 million |
46.6% |
Healthcare |
414 million |
37.9% |
Mobile phones are by far the most popular way to access the internet, used by 99.9% of China’s internet users.
What about the future? China’s Ministry of Ecology and Environment has proposed a new carbon footprint management system, which is due to begin in 2027 and will set standards for measuring the carbon emissions of products like coal and gas, while encouraging the use of products with lower emissions. The country also has some targets to meet by 2025, under the Paris agreement.

Digital activity plays a huge role in China’s carbon footprint, with around 1.09 billion internet users.

France
France emitted 385 million tonnes of CO2-e in 2023, a 4.8% reduction from 2022. Emissions have dropped by 29% since 1990.
The country has 60.80 million internet users, which is around 93.8% of the population. 50.70 million people use social media — 78.2% of the population. 53% of France’s internet traffic comes from five sources: Akaumi, Amazon, Facebook, Google and Netflix. Suggestions to limit internet use to 3GB of data per week were met with scorn, with critics pointing out that many use 3.5GB of data per day on mobile devices alone.
France has two main climate targets:
Reduce greenhouse gas emissions by 36% compared to 2005 by 2030
Become carbon neutral by 2050
They also have the Paris 2024 Summer Olympic Games to consider, with an aim of not exceeding 1.5 million tonnes of emissions. (For context, previous summer games have emitted an average of 3.5 million tonnes.)

France emitted 385 million tonnes of CO2-e in 2023, a 4.8% reduction from 2022.

Germany
Germany’s carbon footprint was 673 million tonnes of CO2-e in 2023, well below their goal of 722 million tonnes and 46% below the 1990 figures.
The most recent data shows there are around 77.70 million internet users in Germany, around 93.3% of the population. Meanwhile, there are 67.80 million active social media accounts, a decrease of 4.4% compared to early 2023. Overall, Germans seem to be less enthused by social media than other nationalities, with a difference of 42% between those who use social media platforms and those who use the internet.
Looking ahead, Germany aims to:
Reduce its greenhouse emissions by 65% by 2030 compared to 1990. Excitingly, they are currently in a position to do this ahead of schedule, with projections for 2024 predicting a reduction of nearly 64%.
Become carbon neutral by 2045.

The most recent data shows there are around 77.70 million internet users in Germany, around 93.3% of the population.

India
Carbon emissions increased by just over 7% in 2023, to 2,800 million tonnes of CO2-e. It’s worth noting, however, that their per capita emissions (i.e. their emissions per person) are around 2 tonnes, less than half of the global average (4.6 tonnes).
As for the internet, there are 751.5 million users in India, which is roughly 52.4% of the population, while their 462 million social media users equate to 32.2%. These percentages are lower than in many other countries and suggest their digital carbon footprint has less of a contribution to their overall carbon footprint.
India’s current net zero target is 2070, with other goals to hit in the lead up. For example, they aim to reduce emissions intensity with respect to GDP by 33-35% compared to 2005 by 2030. They also hope to increase use of renewable energy, reaching 40% installed electricity generation capacity from non-fossil fuels by 2030.

Per capita emissions (i.e. their emissions per person) are around 2 tonnes, less than half of the global average (4.6 tonnes).
Indonesia
Indonesia’s total carbon emissions for 2022 were 692 million tonnes of CO2-e, with the country relying on fossil fuels for 80% of its electricity. Hydropower supplies 8% and is the largest source of renewable energy.
There are 185.3 million internet users in Indonesia, which is around 66.5% of the population. Social media users equated to 49.9% of the population, at 139 million. Accessibility to the internet varies in different parts of the country. For example, the number of internet users in rural areas is increasing as the infrastructure improves and the costs get lower, with popular digital activities including communication, entertainment, and finding information about agriculture. People in these locations are expected to make up 30.5% of Indonesia’s internet users by the end of the year.
Internet access has been available for longer in urban areas due to better infrastructure and faster connections, with people in these locations expected to make up 69.5% of total internet users by the end of the year.
Indonesia aims to reach net zero by 2060, brought forward from their previous goal of 2070. In the meantime, the Just Energy Transition Partnership (JET-P) proposes a minimum of 44% renewable energy use by 2030. The country also signed a pledge at COP26 to phase out coal, retiring coal power plants between now and 2060.
Indonesia relies on fossil fuels for 80% of its electricity. Hydropower supplies 8% and is the largest source of renewable energy.
Iran
There’s comparatively little information about Iran’s carbon footprint and digital activity compared to other countries. We do know that Iran’s carbon footprint for 2022 was 690.64 million tonnes of CO2-e, down from 710.8 million tonnes in 2021.
There are 73.14 million internet users in Iran — around 81.7% of the population — and 48 million social media users (53.6% of the population).
Iran is yet to set a target year for net zero, and its share of renewable energy is less than 1%.

Iran’s carbon footprint for 2022 was 690.64 million tonnes of CO2-e, down from 710.8 million tonnes in 2021.
Japan
Japan’s most recent Annual Report on the Environment in Japan showed the country’s carbon footprint was 1,122 million tonnes of CO2-e, an increase of 2% on the previous year due to COVID-19 recovery. Fossil fuels account for 73% of electricity. More promisingly, 47.6 million tonnes of the country’s emissions were absorbed, thought to be because of the increase in forest improvement projects.
Japan has approximately 104.4 million internet users, around 84.9% of the population. The gap between internet users and social media users is smaller than a lot of other countries, with 96 million people (78.1%) using social media. They’ve seen some interesting changes in user behaviour, notably the way in which people watch live events. Until 2022, live events were only broadcast on TV, so internet traffic would go down while people concentrated on the programme. But some events are now being shown through internet live streaming, which requires faster speeds and a strong connection.
Japan has many data centres, which have traditionally been located in Tokyo and Osaka — both highly populated cities. However, centres are increasingly being built in suburban areas instead, to take advantage of the lower prices.
Japan’s net zero target year is 2050. In addition, they aim to cut carbon emissions by 46% by 2030 compared to 2013 figures.

The gap between internet users and social media users is smaller than a lot of other countries, with 96 million people (78.1%) using social media.
Netherlands
The Netherlands has a relatively low carbon footprint compared to many other nations, with the 2023 figures measuring at 167.85 million tonnes of CO2-e. This is partly because of its small size, and partly because use of coal, oil and natural gas has gradually been falling due to increased use of renewable energy sources like wind and solar.
We can guess from the most recent figures that the digital world contributes significantly towards the overall carbon footprint of The Netherlands: their 17.47 million internet users comprise 99% of the population. 15 million are present on social media — around 85% of the population, with the most popular activities being:
Sending messages (56%)
Liking posts (50%)
Commenting on posts (42%)
Publishing their own posts (35%)
One study found that The Netherlands is the most active European country online, with 84.2% using the internet for e-commerce, 84.7% using it to make calls, and 25.57% using it for finances (a lower number than the other figures, but still high compared to other nations). When you think about how shopping and banking used to be activities you did in person, rather than through a screen, you can see how this would add to the overall digital footprint.
The Netherlands has multiple climate targets in place, aiming to:
Reduce their greenhouse gas emissions by 49% by 2030, compared to 1990 figures
Reduce these emissions by 95% by 2050, compared to 1990 figures
These goals are part of the Climate Act.

One study found that The Netherlands is the most active European country online, with 84.2% using the internet for e-commerce.

Saudi Arabia
There’s relatively little information on Saudi Arabia’s emissions, but we do know their 2023 carbon footprint was 810.51 million tonnes of CO2-e.
We also know their internet and social media use is high, at 36.84 million (99%) and 35.10 million (94.3%) respectively, so we can assume their digital activity plays a significant role in the overall footprint.
Their net zero target year is 2060.

There’s relatively little information on Saudi Arabia’s emissions, but we do know their 2023 carbon footprint was 810.51 million tonnes of CO2-e.
South Korea
South Korea’s carbon footprint in 2023 was 725.74 million tonnes of CO2-e.
97.2% of the population use the internet (approximately 50.30 million people), while 93.4% use social media (48.34 million people). 94.8% have a smartphone, which are often used for banking, shopping, storing e-tickets and paying for goods and services. This is a significant increase on the 2011 figure of 22%, when all these activities were done with physical cash and cards.
South Korea’s net zero target year is 2050. They also have targets for 2030, aiming to cut emissions by 40% of 2018 levels.

94.8% have a smartphone, which are often used for banking, shopping, storing e-tickets and paying for goods and services.
UK
According to the Office for National Statistics, the most recent data on UK greenhouse gas emissions shows that the UK’s territorial emissions (i.e. emissions that happen within the UK’s borders) were approximately 384 million tonnes of carbon dioxide in 2023. This is 52% less than 1990’s emissions.
There are two other ways the UK measures emissions: residence, or production emissions, which link emissions to economic sectors, and footprint or consumption emissions, which link emissions to the consumption of goods and services by the population. Beyond this the figures aren’t broken down into sectors, so it’s difficult to know how much of this is caused by digital activity. But we do know there were 66.33 million internet users in the UK in January 2024 (97.8% of the population) and 56.2 million social media users (82.8% of the population).
Ofcom’s most recent Online Nation Report found that the most popular digital activities in the UK included:
Using social media (98%)
Using a search engine (97%)
Shopping online (87% visited Amazon and 64% visited eBay)
Online gaming (39% of households had at least one console)
Using generative AI (31%)
Using online dating sites or apps (11%)
As for what’s next? Two climate goals were set in 2019:
Reduce carbon emissions by 45% by 2030
Offset the remaining 55%
In 2024, three further goals were announced:
Reduce Scope 1 and 2 emissions by at least 80% by 2030
Have a zero-carbon-emitting fleet of cars and vans by 2027
Have a zero-carbon-emitting 4x4 fleet no later than 2030
With a change in government, it’s yet to be seen whether these goals will be altered. But we do know that the ban on onshore wind farms has been lifted.

UK’s territorial emissions were approximately 384 million tonnes of carbon dioxide in 2023. This is 52% less than 1990’s emissions.

US
In 2022, the most recent reporting year, greenhouse gas emissions in the US were approximately 6,343 million tonnes, a 3% decrease since 1990. The sectors with the most impact were transport (28.4% of emissions) and electric power (25% of emissions). 13% of carbon emissions were offset that year, mostly through tree growth and more efficient land management.
There are 331.1 million internet users in the US, which is around 97.1% of the population, while 239 million are using social media, around 70.1% of the population. 80% of Americans have home broadband internet, with ease of access depending on location. The US cities with the best internet access are:
Salt Lake City, Utah
Atlanta, Georgia
Colorado Springs, Colorado
San Francisco, California
Tampa, Florida
The US currently has four main climate goals:
Achieve net-zero emissions by 2050
Reduce US greenhouse gas emissions by 50-52% in 2030, compared to 2005 levels
Reach 100% carbon pollution-free electricity by 2035
Deliver 40% of the benefits from federal investments in climate and clean energy to disadvantaged communities

In 2022, the most recent reporting year, greenhouse gas emissions in the US were approximately 6,343 million tonnes, a 3% decrease since 1990.
If we look at the world as a whole, internet users spend an average of 6.5 hours a day online. The internet will use 20% of the world’s electricity and produce 3.5% of the world’s greenhouse gas emissions if we continue in the same direction current trends suggest.
This is a lot of information to take in, and you might be feeling slightly overwhelmed. But don’t panic — in the next chapter we’ll look at what can be done to reduce digital carbon footprints.

Working towards a more sustainable future
You will have seen the concept of net zero mentioned throughout chapter three. Net zero is a goal where emissions are cut down to as close to zero as possible, by balancing the amount of emissions produced with the amount of carbon removed from the atmosphere. Carbon can be removed by switching to renewable energy sources like solar, wind, and hydropower, planting trees to capture carbon dioxide, cutting down consumption, and making energy-saving devices the default.
As carbon-saving measures are introduced and become more common and accessible, it makes it easier for businesses and individuals to increase their sustainability efforts.
Reducing the digital carbon footprint for businesses
It’s not enough anymore for companies to focus solely on profit. Sustainability must be taken into account as the effects of climate change grow greater — not to mention people are already looking for environmental policies when they choose who they give their custom to and even who they work for. Over 40% of consumers actively choose brands with environmentally conscious values and there’s been a 71% increase worldwide in online searches for sustainable goods.
Here are some steps businesses can take to reduce their digital carbon footprint:

Use renewable energy to power your office wherever possible.

Use data centres which are powered by renewable energy and run by providers that take sustainability into account.

Use your resources carefully. It requires less energy to use one application that meets lots of your needs than it does to power multiple applications (and is often cheaper, too). It also reduces the number of servers you need.

Use server visualisation technology to reduce the number of servers you need.

Only store data that is absolutely necessary, and use technology to automatically get rid of duplicates.

Regularly review your energy use to see where you can improve and reduce consumption.
Businesses have the opportunity to make a significant difference — it’s estimated that the ICT sector’s carbon footprint could be lowered by more than 80% if all electricity came from renewable energy, for example.
Reducing your digital carbon footprint
There’s so much information about climate change that you might not know where to start. The good news is there are things you can do to reduce your own impact, including your digital carbon footprint.
Cut back on streaming
While the actual carbon footprint of streaming isn’t too high, lots of people doing it soon adds up to increase emissions. These emissions are from the device, the internet network, data centres, and servers. Downloading the content you want to watch is much less energy intensive and means you don’t have to miss out.
Play songs as audio files
Video uses more energy than audio.
Repair your devices before replacing them
It uses more emissions to create an entirely new device than it does to replace the parts. Many common phone issues (cracked screens, broken batteries etc) can easily be fixed — and it costs a lot less than buying something new.

Downloading the content you want to watch is much less energy intensive and means you don’t have to miss out.
Recycle your devices when they’re no longer usable
There’s a way to dispose of old tech that reduces its harm on the environment. Sending it to landfill can release toxic chemicals, but recycling different parts of your phone keeps it in circulation for longer. Many recycling centres offer tech disposal, and some sites will pay you in exchange for your old phone.
Consider refurbished tech
Plenty of devices are gotten rid of while they still work perfectly fine. But by restoring them to a better condition, they can be used by someone new and be saved from landfill. They also (you guessed it) cost less than buying a new device, and come with a warranty for peace of mind.
Declutter your inbox
Every email takes up space and therefore data storage. Regularly go through your inbox to remove anything that you no longer need and you’ll reduce your digital footprint as well as the virtual clutter.
Store data differently
Many of us use cloud storage, but that requires energy. An alternative is transferring your files to physical hard drives, as these will only use energy when you plug them in. (Having two allows for back-up in case of an emergency.) If you’re worried you won’t remember to back up your files, you can instead focus on decluttering what’s stored in the cloud so you only ever keep what you want and need.

Plenty of devices are gotten rid of while they still work perfectly fine. They can be used by someone new and be saved from landfill.

Useful Links
What is climate change?
https://www.metoffice.gov.uk/weather/climate-change/what-is-climate-change
What is a digital carbon footprint?
https://www.myclimate.org/en/information/faq/faq-detail/what-is-a-digital-carbon-footprint/